2025 7-District Budget Dashboard in Pictures Part Three: Special Needs
Special Needs Per Pupil Cost Break Down for Berkeley Heights, Chatham, New Providence, Summit, Millburn, Madison, and Westfield
Part Three of our effort to break down the 7-District Budget Dashboard in supporting residents of Berkeley Heights, Chatham, New Providence, Summit, Millburn, Madison, and Westfield provide more informed feedback to their Boards of Education during the upcoming budget process.
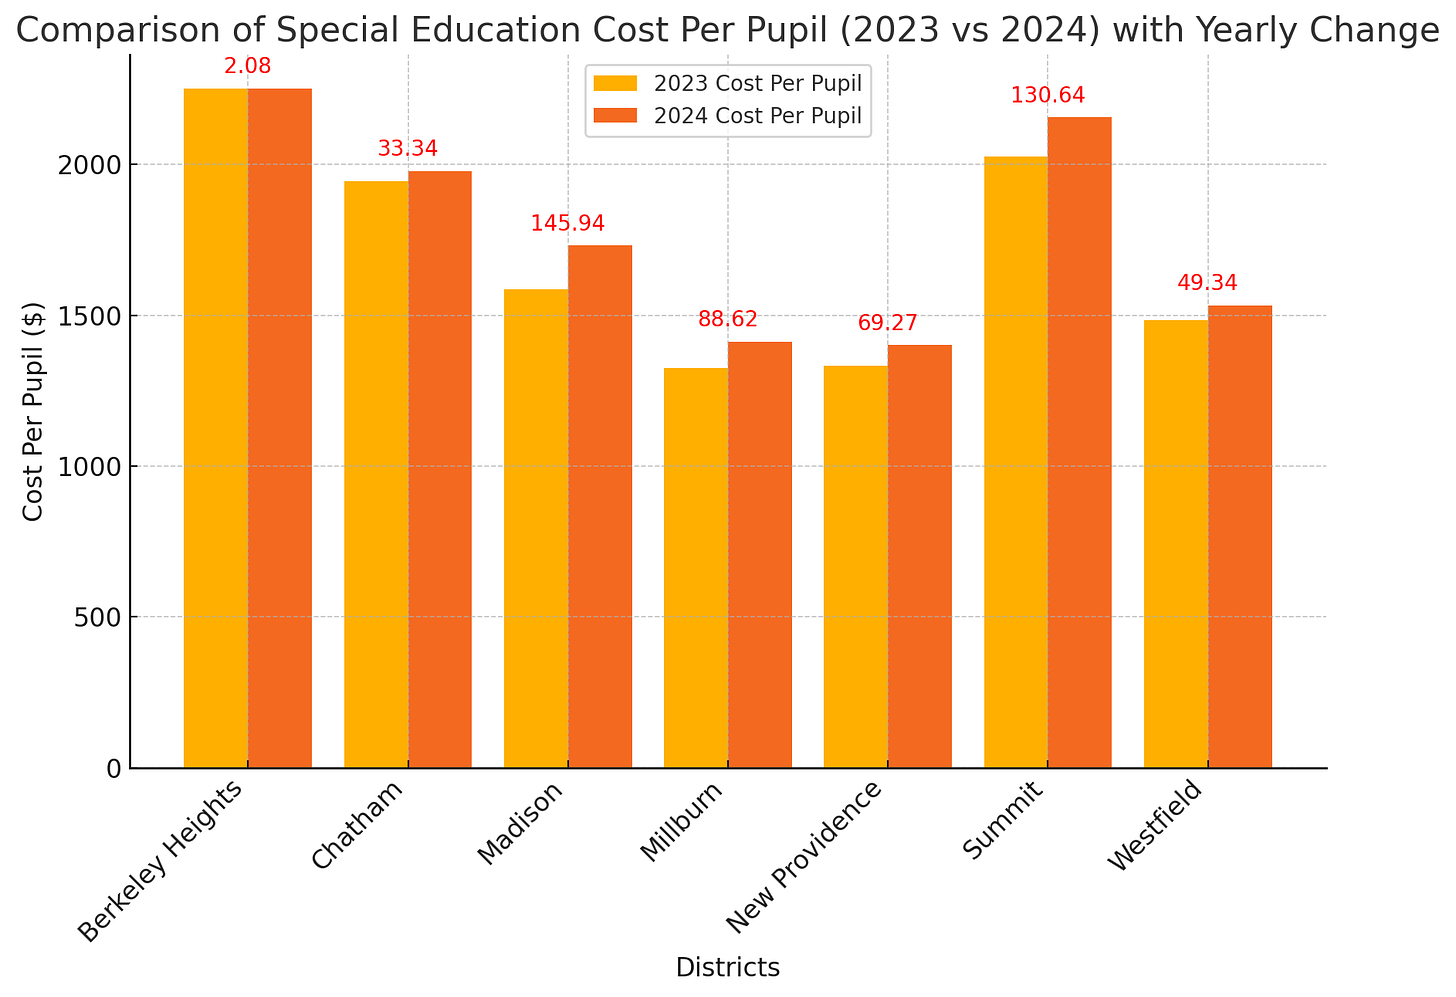
Special Education
Most districts saw an increase in the per-pupil cost of special education instruction from 2023 to 2024.
Madison had the highest percent change at 9.2%, followed by Millburn at 6.7%.
Berkeley Heights had the lowest percent change at 0.09%, followed by Chatham at 1.7%.
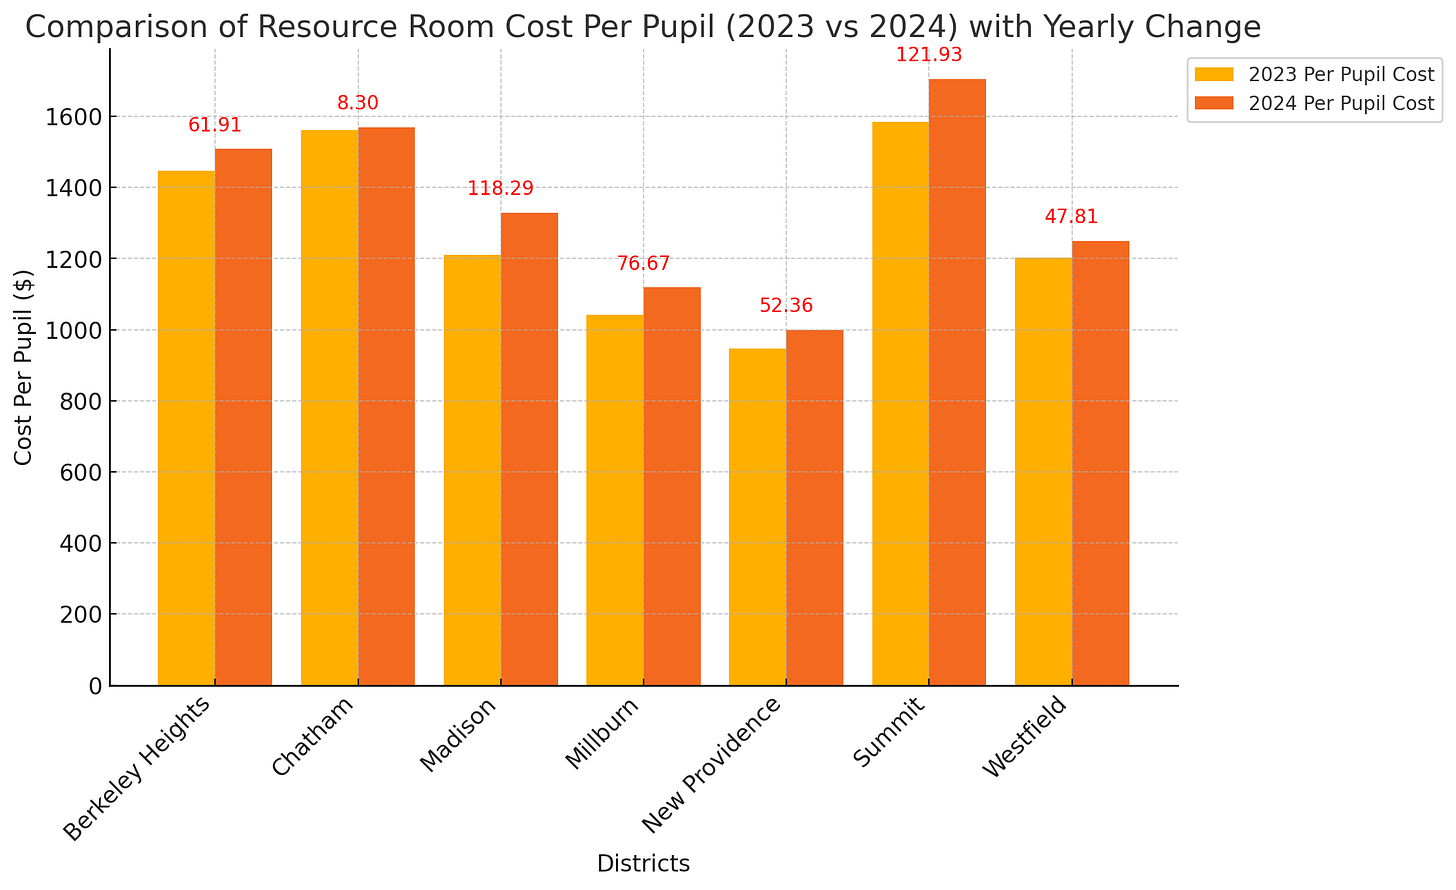
Resource Room
Most districts saw an increase in the per-pupil cost of resource rooms from 2023 to 2024.
Madison had the highest percent increase at 9.8%, followed by Summit at 7.7%.
Chatham had the lowest percent change at 0.5%, followed by Westfield at 4.0%.
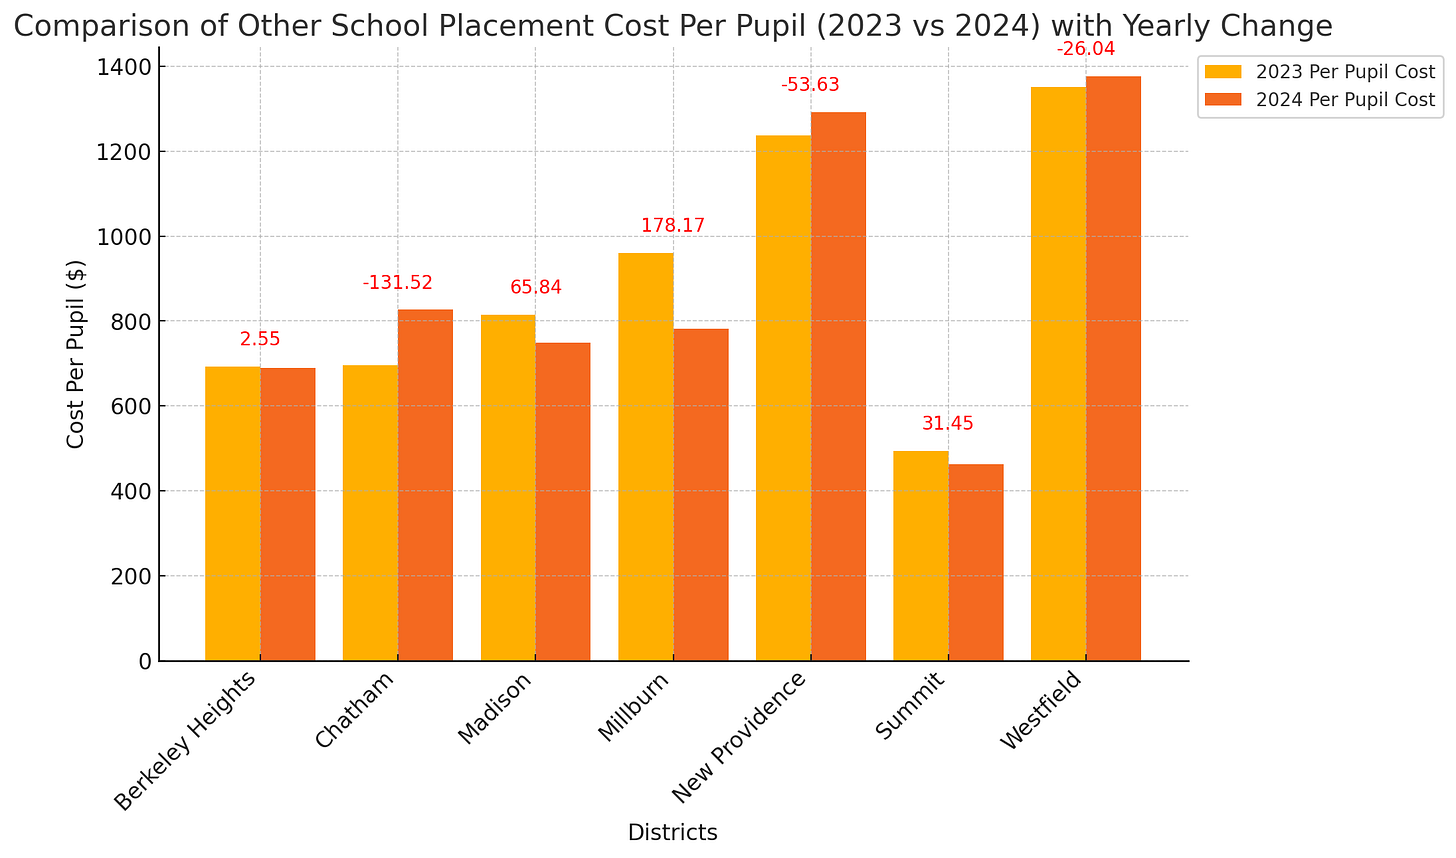
Other School Placement
Most districts saw a decrease in the per-pupil cost of other school placements from 2023 to 2024.
Chatham had the highest percent increase at 18.9%.
Millburn had the highest percent decrease at -18.6%.
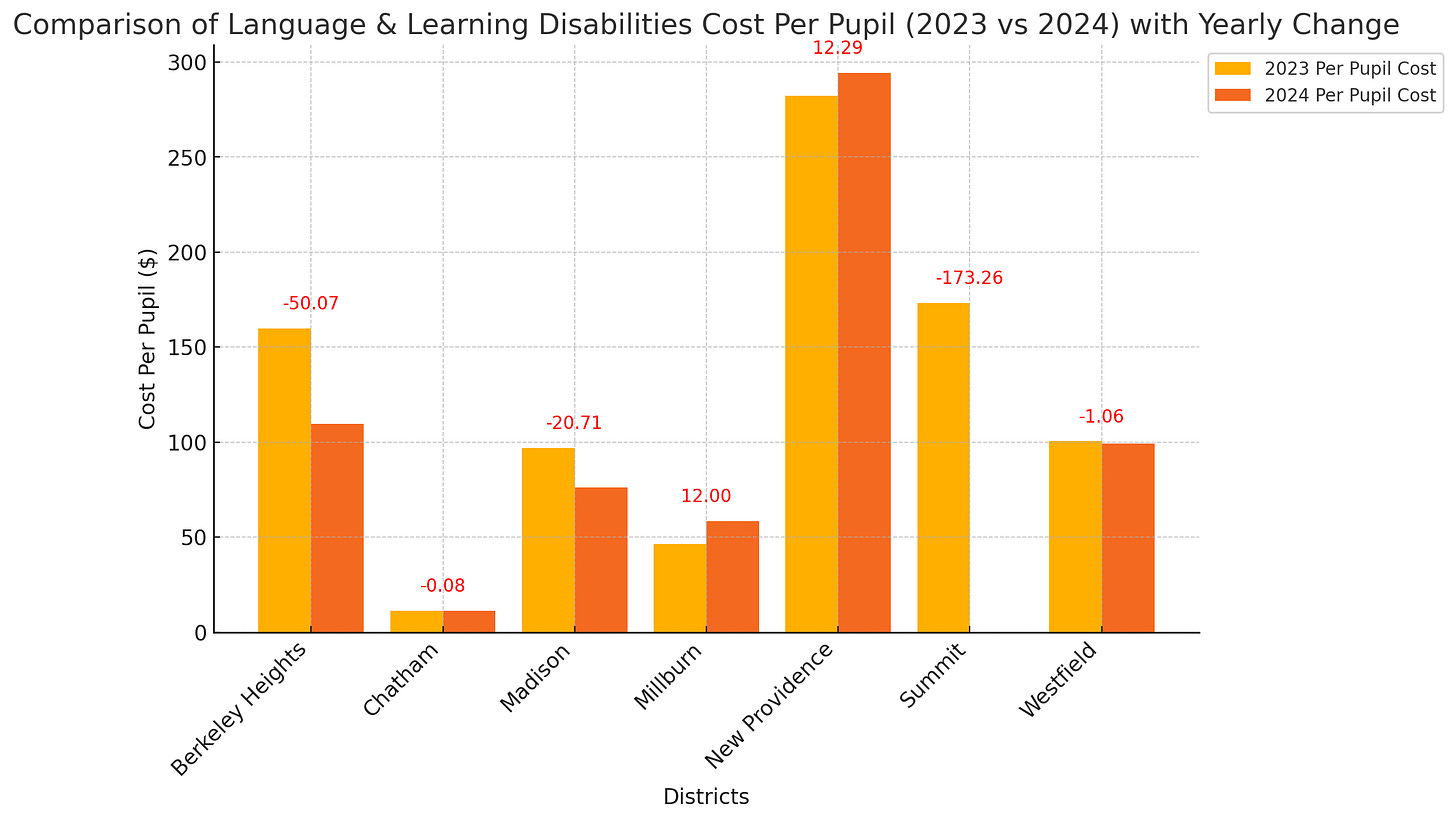
Language & Learning Disabilities
Most districts saw a decrease in the per-pupil cost of Language & Learning Disabilities programs from 2023 to 2024.
Millburn had the highest percent increase at 25.8%.
Summit had the highest percent decrease at -100.0%, followed by Berkeley Heights at -31.3%.
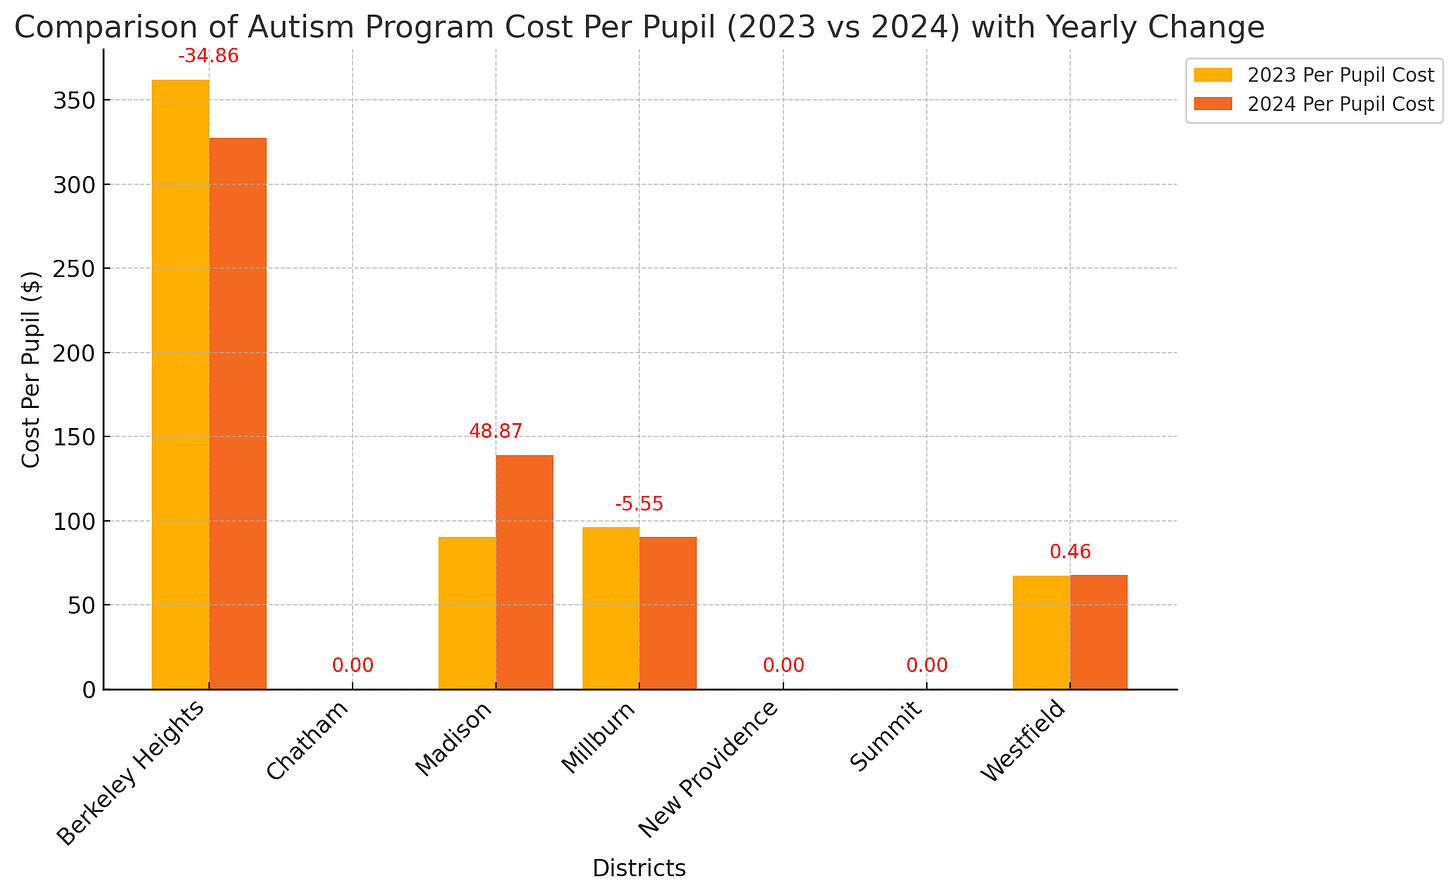
Autism
Most districts saw a decrease or no change in the per-pupil cost of Autism programs from 2023 to 2024.
Madison had the highest percent increase at 54.2%.
Berkeley Heights had the highest percent decrease at -9.6%.
Chatham and New Providence had 0 costs for both years.
Total Spending Across All Five Categories
Madison had the largest increase in spending, going from $3,799.22 per pupil in 2023 to $4,025.78 in 2024, a change of $226.56.
Millburn and Berkeley Heights were the only districts to decrease their spending between the two years.
The overall average change in spending per pupil across all districts was an increase of $103.96.


